Quick Start
NOC is a system for collecting network information and monitoring. Originally created as a tool for automating equipment management, it has grown to include modules for collecting information, monitoring, and working with metrics. Despite the complexity of operation and numerous settings, NOC offers advantages through its "Everything about the network in one place" approach.
Since it was developed from the beginning for network operation, many concepts and terminology are taken from it. To better understand the subject matter, we need to explain a few terms:
- ManagedObject (
Network Device,Managed Device) - any equipment accessible via an IP address. - Pool (
Pool) - when working with devices that have the same IP address, they can be placed in different pools. Each pool has its own set of processes, which allows you to keep devices separate from each other. - Interfaces (
Interfaces,Ports) - hardware components designed for communication via links. In NOC, they exist separately from the devices, allowing you to work with them as an independent part of the system. - Links (
Link) - used to connect interfaces to each other. NOC supportsL2topology, so links can only be established between physical ports. - SA Profile (or simply
Profile,Equipment Adapter) - a set of scripts and equipment configuration settings. Included in the system's main code. Their combination determines how the system collects information from the device. - Profiles (
Profiles,Group Settings) - Most settings in the system are placed in profiles. This allows you to manage groups of similar objects through profiles, instead of configuring each device or interface individually. Examples of profiles include: - Capabilities (
Caps,Features) - record additional knowledge about equipment (its capabilities). For example, whetherSNMPis supported and which version. Included protocols, and so on. - NetworkSegment (
Network Segment) - a way of topologically grouping equipment. The segment's layout is displayed on the segment diagram, and it determines the upward direction. - AdministrativeDomain (
Administrative Domain) - used to separate access rights to equipment. - Discovery - the procedure for collecting information from equipment using profile scripts (
SA Profile).
User Interface
The web interface of the system is accessible via the IP address https://<installed_ip>. The login credentials are as follows: username - admin, password - admin. 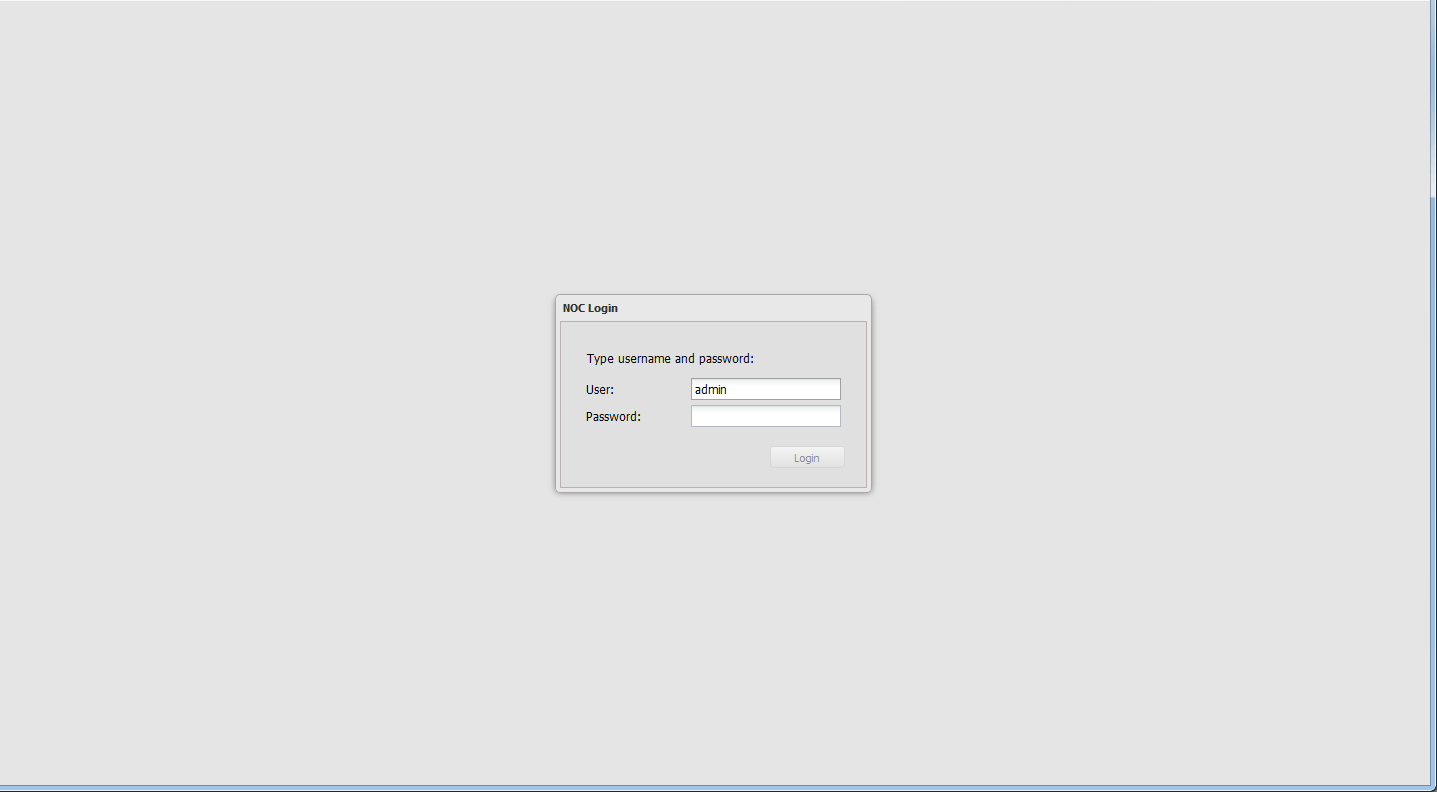
After logging in, you will see the main interface of the system, which consists of the following parts (highlighted by the green border in the image): 1) Navigation Panel 2) Window Header 3) Workspace 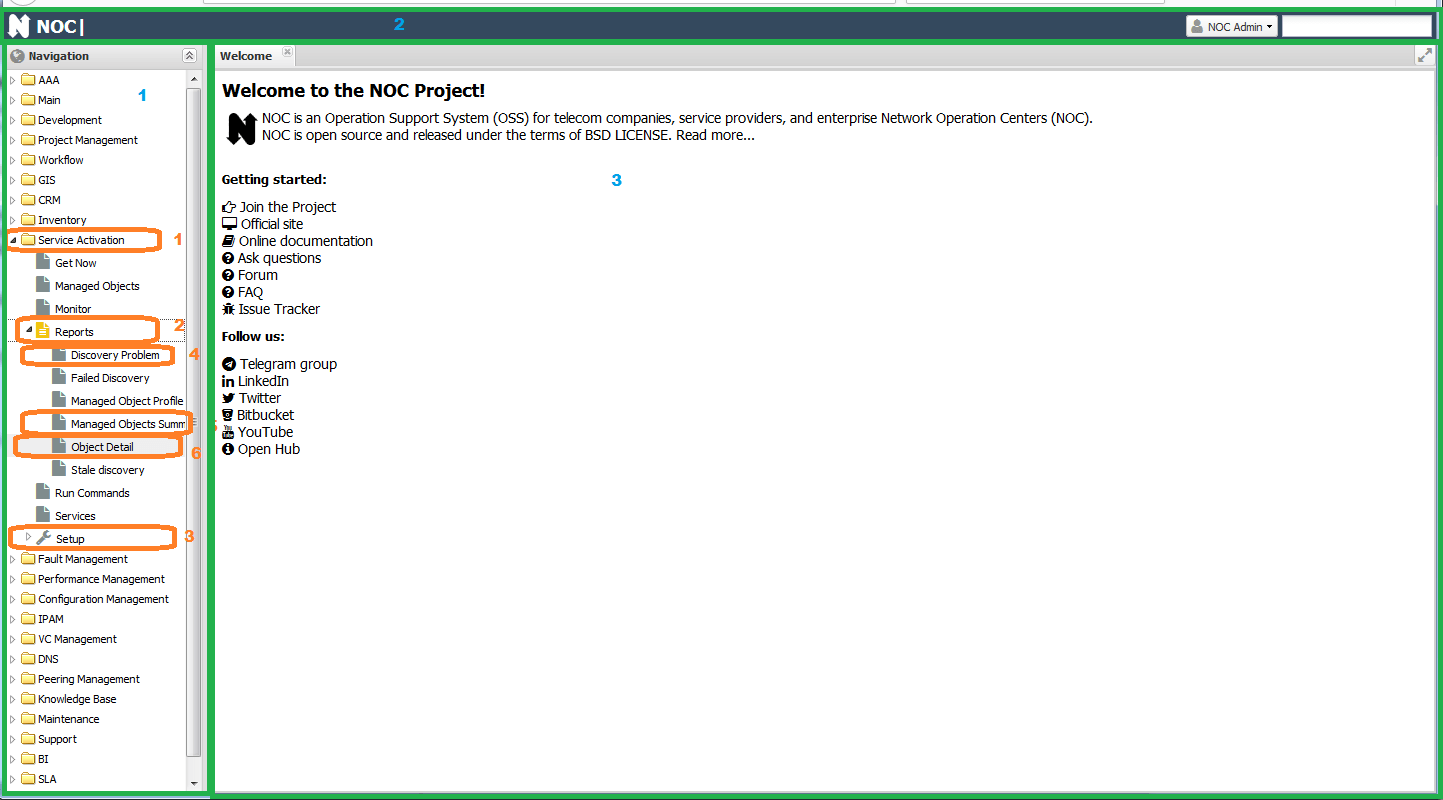
The navigation is structured as follows: * <System Component> * <Base Application> - located at the root of the component and usually represents the core functionality. * <Settings> (number 3) - contains various settings. * <Reports> (number 2) - various reports are organized in this section and divided into categories: * Summary (number 5) - typically a table displaying aggregated data about the system. * Details (number 6) - data export in Excel/CSV format. * Report (number 4) - an HTML table with data corresponding to the report's title.
The top-level navigation includes the system's basic modules: * AAA - user and group settings * Main - system settings that do not fit into a separate section * Project Management - project creation * Workflow - creation and editing of workflows for system elements * Inventory - inventory information about equipment, segments, and interfaces * Service Activation - device addition and polling configuration * Fault Management - working with faults and events * Performance Management - adding/removing new metrics to the system * Configuration Management - configuration validation settings for devices * IPAM and DNS - IP address space management * VC Management - VLAN management * Maintenance - maintenance configuration * Phone - phone number tracking
On the second level, you can access applications within each module: * AAA -> Setup * Users - system users * Groups - user groups * Inventory * Mac DB - MAC address database * Network Map - segment diagram * Service Activation * Managed Object - list of devices (equipment) * Run Commands - running commands on devices (equipment) * Fault Management * Alarms - list of alarms * IPAM * Assigned Address - IPAM database * VRF -
Adding a Device
The primary application for working with devices is Managed Object (Service Activation -> Managed Object). The initial page displays a table (3), with a filter panel on the right (2). At the top of the screen, there is a search bar (1). 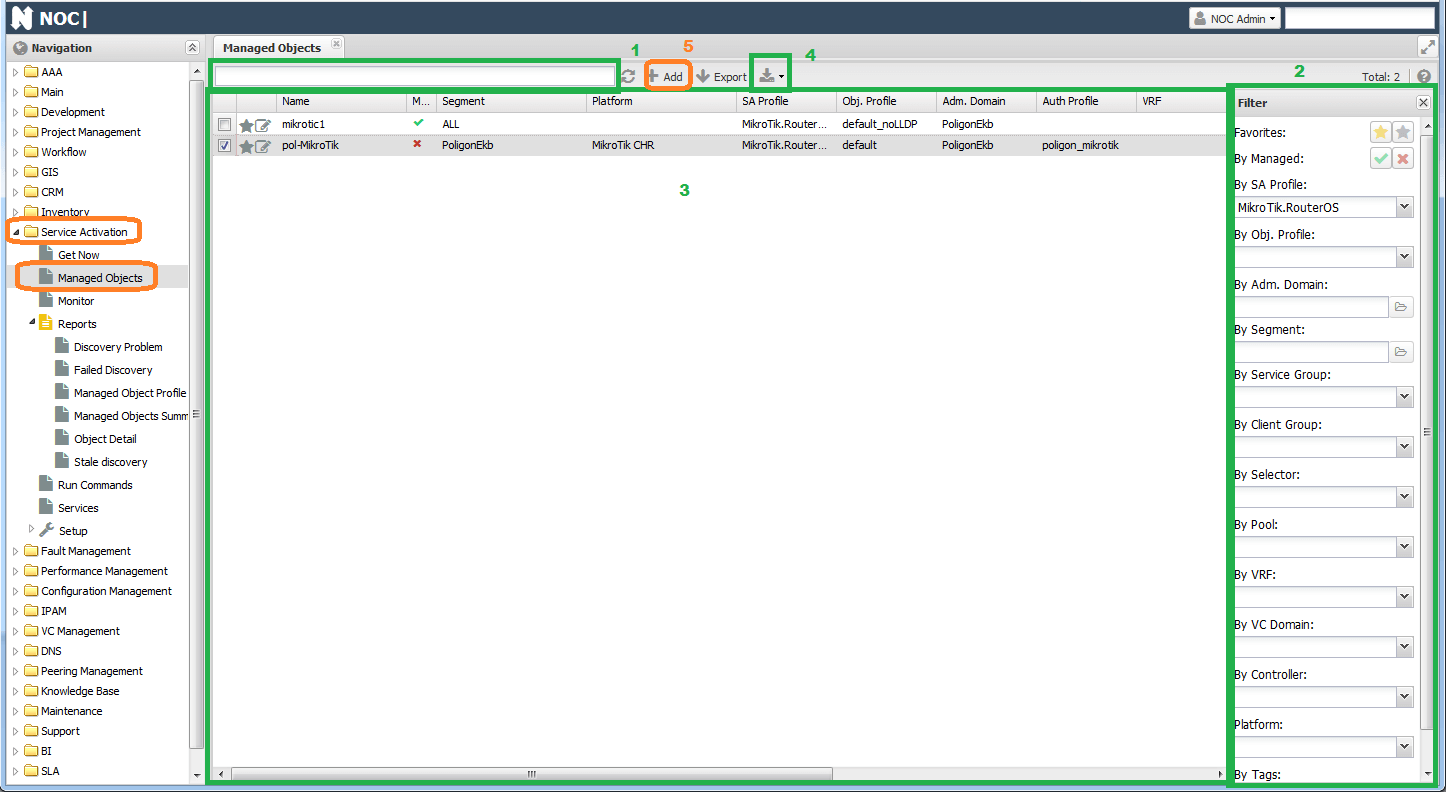
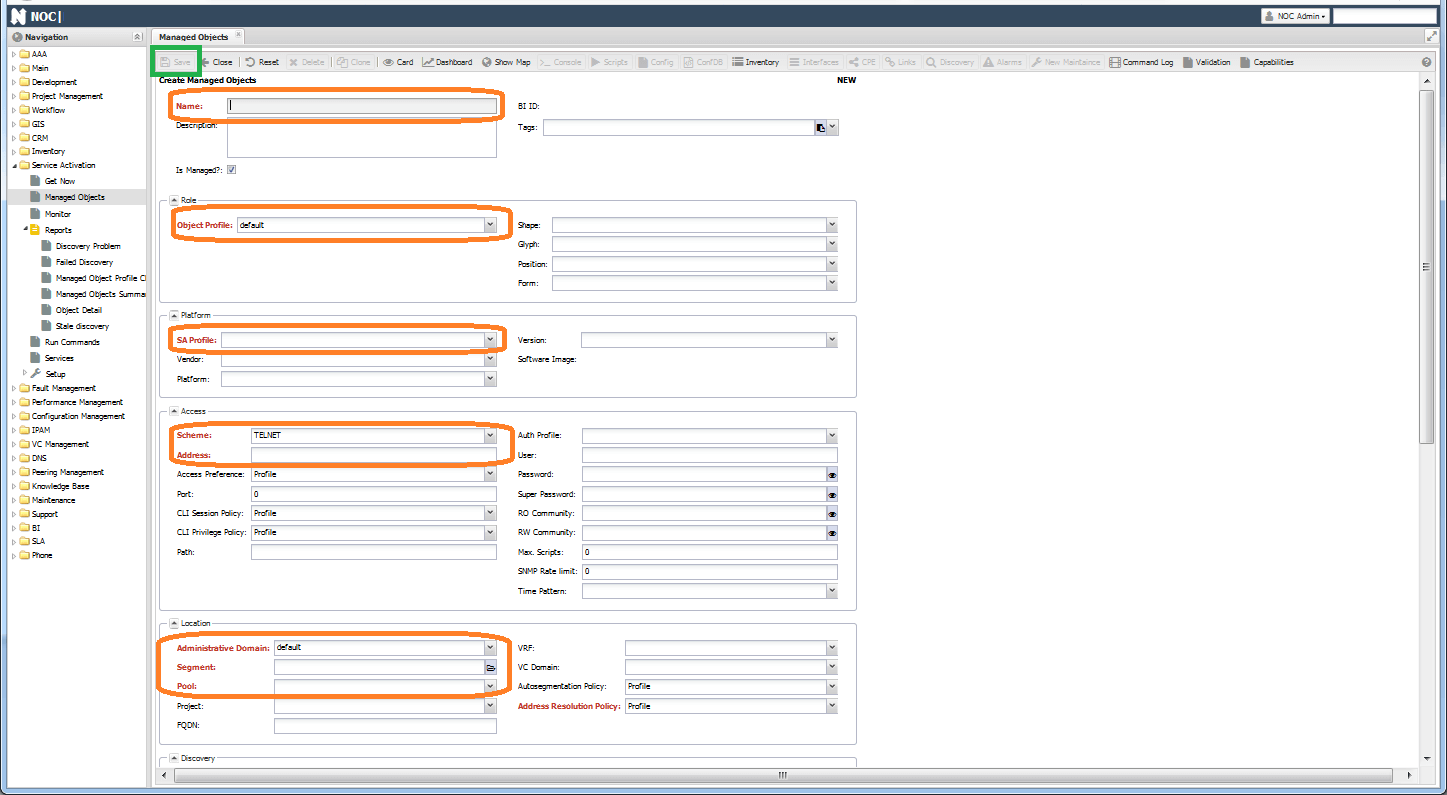
To add a device, click the Add button (5), which opens an addition form. The required fields for completion are:
- Name - the device's name (must be unique)
- Object Profile - polling settings. By default, it is set to
default. - SA Profile - Profile for working with the device. By default,
Generic.Hostis used, but you need to set a more suitable profile that corresponds to the device's operating system. - Scheme - the protocol for accessing the device. By default,
TELNETis selected. Options includeSSH/HTTP/HTTPS. - Address - the device's IP address.
- Administrative Domain - the administrative domain. By default, it is set to
default. - Segment - the network segment where the device is located. By default, it is set to
ALL. - Pool - configured during installation, devices will be polled from it.
- Address Resolution Policy - used if the device has a dynamic IP address. When activated (
Enable), fill in theFQDNfield with the device's domain name (it must resolve from the system's host).
The fields User, Password, Super Password, and RO Community are not mandatory but are necessary for working with equipment via CLI (User and Password) and/or SNMP (RO Community). The Auth Profile is used for grouping identical access settings and is created in Service Activation -> Setup -> Auth Profile.
Note
When the Auth Profile field is filled, individual settings are ignored on the device.
In the Event Sources section, settings for receiving SNMP Trap/Syslog from the equipment are located. If necessary, switch the Event Policy to Disabled.
Note
The Vendor, Platform, and Version settings will be filled during polling.
The remaining settings can be left as default. If everything is filled in correctly, the Save button is activated in the top toolbar of the form.
Upon success, a line with the added device will appear in the device list. Remember that adding a device does not imply polling of the device. It will need to be configured separately in ManagedObjectProfile.
Note
In the list of pools, you may encounter P0001. It is created during migration from older system versions, and for the device to work, you need to replace it with the working pool (usually, default).
Mass Device Entry
Adding devices through the web interface works well when there are only a few. To add a large number of devices, you can use CSV import. It is located in the menu Main -> Setup -> CSV Export/Import. In the list, you need to select sa.ManagedObject and click Export. You will get a file with a list of all devices in the system. For importing, you need to keep the following columns in this file:
- name
- is_managed
- administrative_domain
- segment
- pool
- profile
- object_profile
- address
- user
- password
- super_password
- trap_source_type
- syslog_source_type
- snmp_ro
Enabling Polling
In the device addition form, you specified the Object Profile. This is the main element for configuring the polling schedule and composition (Discovery). Usually, several profiles are created for groups of devices with different settings. Afterward, you assign them in the device form (Managed Object).
Go to Service Activation -> Setup -> Managed Object Profile. After installation, only one profile is available in the list - default. 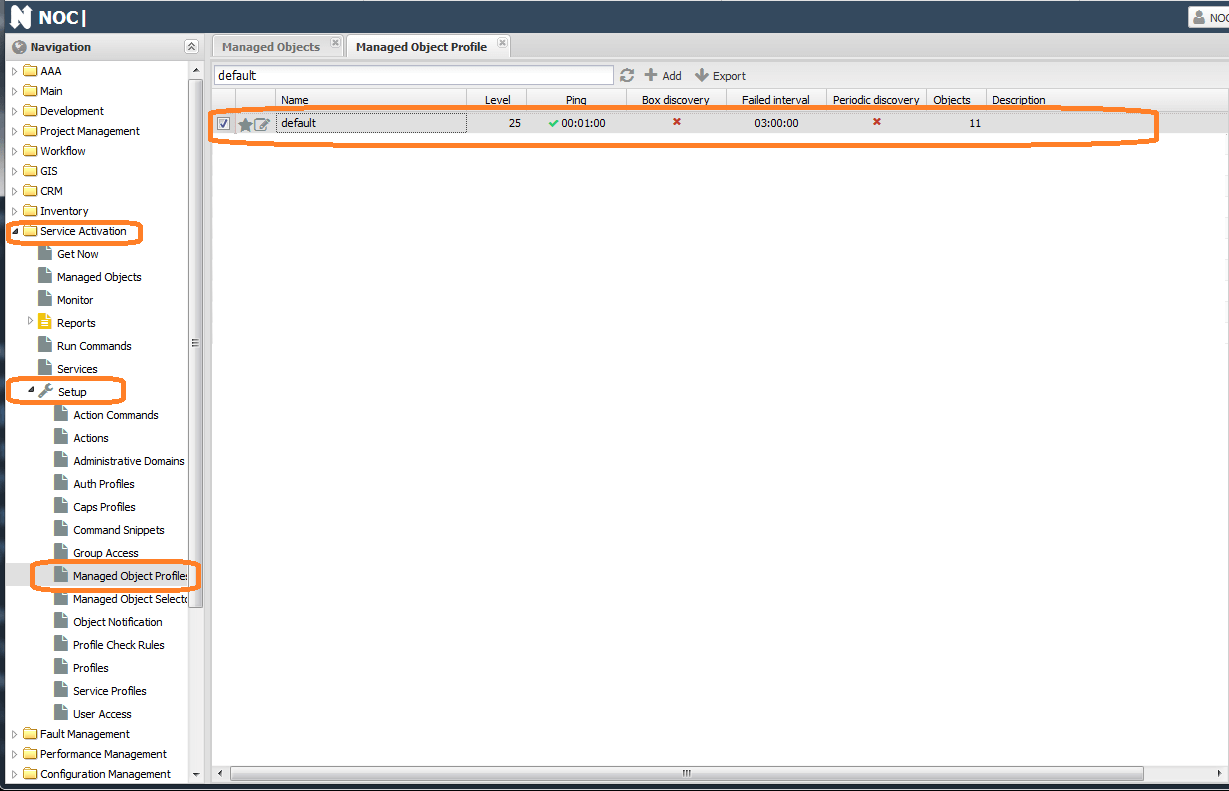
Note
When adding a new device profile, on the Common tab, set Address Resolution Policy to Disabled, or else the save button won't be activated.
Inside the form, it is divided into tabs by setting groups. The main ones are:
- Common
- Ping Check - settings for availability checks (via
ICMP) - Box discovery - settings for full discovery
- Periodic Discovery - settings for periodic polling (metrics and interface statuses)
- Metrics - metrics collected from the device
- Config - settings for working with device configuration (text config)
Availability checks are activated on the Ping Check tab with the Enable checkbox. On this tab, you can also configure the interval and parameters of the sent ICMP packet. There are 2 policies for determining recovery of availability:
First Success- considered available if the first packet in a series is returned.All Success- considered available if all packets in the series are returned.
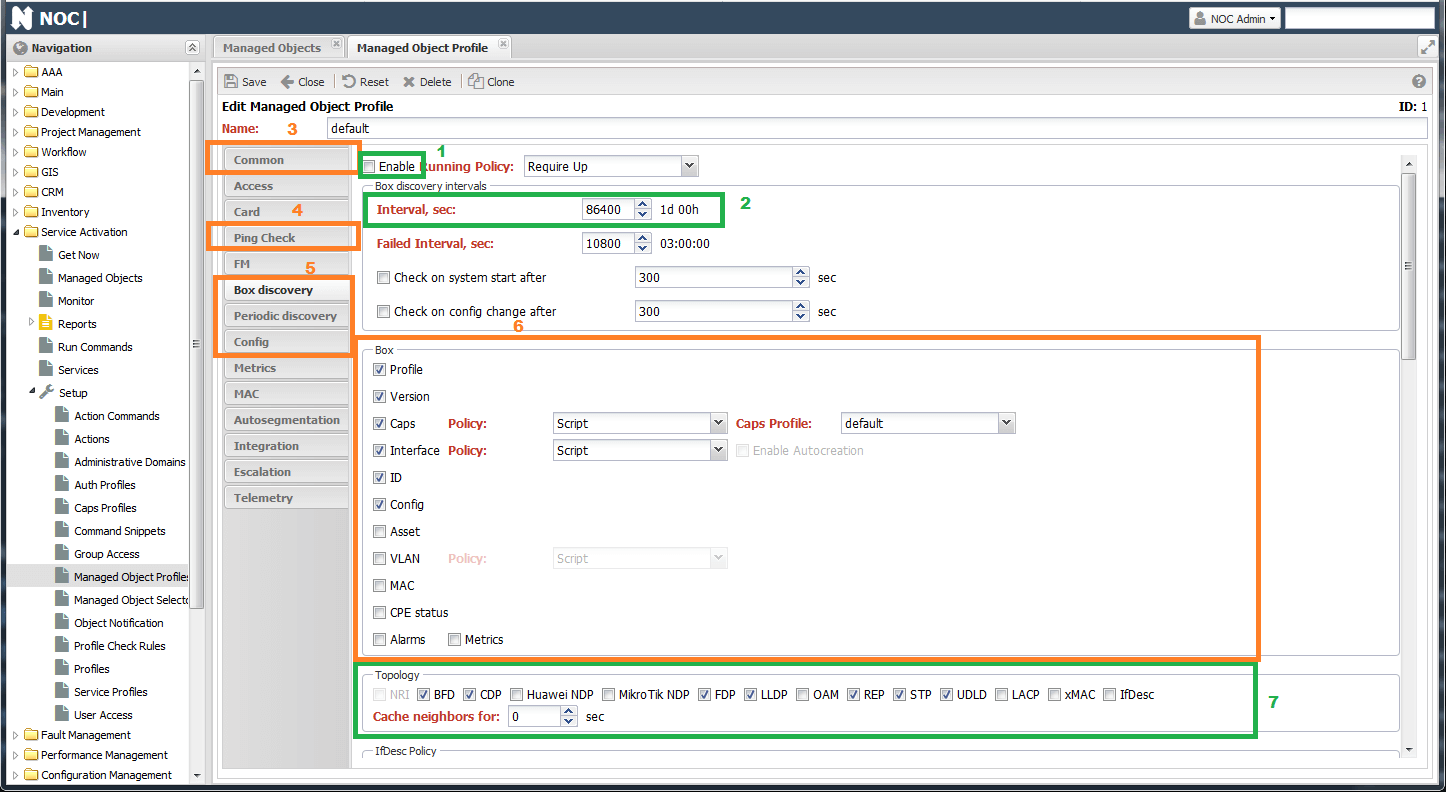
Settings for collecting information from the equipment are configured on the Box tab. To enable, just check the Enable checkbox and check the required types of polling in the Box section:
- Profile - NOC will attempt to determine the device's Profile. Determination works via
SNMPbased on rules fromService Activation->Setup->Profile Check Rules. - Version - collects the manufacturer (
Vendor), platform (Platform), and version (Version) of the device. Optionally, you can addimageandSerial Number. - Caps - tests which functionality is currently working on the device, all of this is entered in
Capabilities. You can see them in the device form'sCapabilitiesmenu. Testing includesSNMPand various protocols. - Interface - collects ports (interfaces).
- ID - collects the chassis's
MACandhostname(for topology construction). - Config - collects device configuration.
- Asset - collects inventory information (chassis, boards, modules).
- VLAN - populates the VLAN database from the equipment (appears in the
VC Management->Vlanmenu). - MAC - collects the MAC address table (accessible in
Inventory->MacDB). - Metrics - collects configured metrics.
The Topology section includes polling neighbors from the device to collect topology. More on this later.
The IPAM section includes collecting address information from the device and synchronizing it with IPAM. It is displayed in the IPAM -> Assigned Address section.
Housekeeping allows you to expand collection with a custom Python handler.
When Discovery Alarm is activated, faults are created in Fault Management in case of polling errors.
After pressing Save, tasks (Job) will be created to poll the equipment according to the specified interval.
The outcome of the execution can be judged by the logs. They are available in the Discovery section of the device form (Service Activation -> ManagedObject -> <device> ->
Configuring Metric Collection
In addition to enabling metric polling, you need to specify the list of collected metrics. You can divide metric configuration into several types:
- Device Metrics: Configured on the
Metricstab (Service Activation->Setup->ManagedObjectProfile). - Interface Metrics: Require collected interfaces (as part of
Interface Discovery) and are configured in the interface profileInterface ProfileInventory->Setup->Interface Profile. Interface metric names start withInterface. - SLA Metrics: Similar to interface metrics, they require collected
SLAprobes from the device (as part ofSLA Discovery).
Note
If you assign interface metrics to the object, they will not be collected (and vice versa).
For example, settings for collecting device CPU and memory usage will look like this (image).
Settings for collecting interface utilization and packet counts (Inventory -> Setup -> Interface Profile -> <interface_profile>):
Since metrics are collected via SNMP, the device must have an RO Community configured, and its functionality must be successfully verified by the system (as part of Caps Discovery). You can check this in the Capabilities section of the device form (Service Activation -> ManagedObject -> <device>).
Also, to collect interface metrics from the device, the interfaces must be indexed with ifindex. You can verify this in the Interfaces section on the device form by enabling the ifindex column.
When metrics are successfully obtained, the discovery log will show a line like [discovery|periodic|sw11|metrics] Spooling 154 metrics, indicating that the metrics have been sent for database storage. Device graphs are available in the Graphs menu (Dashboard).
Topology
In NOC, besides manual link creation, automatic L2 link discovery is supported when supported by a device using a specific neighbor discovery protocol. Each protocol corresponds to its own method of discovery from the polling side. The complete list of supported methods can be found in the Topology section (Service Activation -> Setup -> Managed Object Profile -> <managed_object_profile> -> Box). The actual supported methods depend on the device model and its implementation in the profile.
To collect topology information from a device, you need to:
- Enable
Caps Discoveryto determine the supported link discovery methods by the device. - Enable
ID Discoveryto collectChassis MACandhostname. These are used as neighbor references in neighbor lists. - In the
Topologysection, enable the methods for link discovery (you can enable all, but only available methods will work).
During polling, NOC will identify the available methods and collect neighbors from the device. Then, it will sequentially access each neighbor and verify whether the original device is present among its neighbors. If confirmed, a link is established, and a log entry is created.
You can view device links in the Links menu on the device form (ManagedObject). They will also appear on the segment map in the Show Map menu.
Note
To create a link, access to the devices on both ends is required.
Alarms
After enabling Ping Check in the Managed Object Profile, NOC starts pinging devices and generates alarms in case of unavailability. Alarms can be viewed in Fault Management -> Alarms.
To receive Syslog/SNMP Trap, you need to configure the message sending address. This is done in the device form under Syslog Source/Trap Source. Several options are available:
Management Address- Device messages come from the address specified in theAddressfield in the form.Specify Address- Device messages come from the address specified in the field below.Loopback Address- Device messages come from theLoopbackaddress (requires filledInterfacefields for the device).All interface addresses- All available addresses on the device, including those collected duringInterface Discovery.
Configuring the Syslog Archive Policy enables the sending of raw Syslog messages to the database. They are available for searching in the BI interface.