NOC Monitoring Howto
Installing Docker and Docker Compose
- Install Docker: Docker Installation Guide
- Install Docker Compose: Docker Compose Installation Guide
Creating docker-compose.yml and Its Environment
(Note: Run all commands as the root user)
- Create a directory where the
docker-compose.ymlfile should be located.and placemkdir -p /etc/docker-compose/mon/docker-compose.ymlfile with following content:version: '3' services: grafana: image: grafana/grafana-oss restart: always ports: - 3000:3000 user: '0' volumes: - "./grafana/data/:/var/lib/grafana/" - "./grafana/grafana-selfmon-dashboards/dashboards/noc/:/var/lib/grafana/dashboards" - "./grafana/grafana-selfmon-dashboards/provisioning/datasources/:/etc/grafana/provisioning/datasources/" - "./grafana/grafana-selfmon-dashboards/provisioning/dashboards/:/etc/grafana/provisioning/dashboards/" networks: - mon vmagent: image: victoriametrics/vmagent depends_on: - "vm" ports: - 8429:8429 volumes: - "./vm/vmagentdata:/vmagentdata" - "./vm/vmagent.yml:/etc/prometheus/prometheus.yml" command: - '--promscrape.config.strictParse=false' - '--promscrape.config=/etc/prometheus/prometheus.yml' - '--remoteWrite.url=http://vm:8428/api/v1/write' restart: always networks: - mon vm: image: victoriametrics/victoria-metrics ports: - 8428:8428 volumes: - "./vm/vmdata/:/storage" command: - '--storageDataPath=/storage' - '--retentionPeriod=60d' - '--httpListenAddr=:8428' restart: always networks: - mon alertmanager: image: prom/alertmanager restart: always volumes: - "./vm:/alertmanager" command: - --config.file=/alertmanager/alertmanager.yml - --web.external-url=https://alertmanager:9093 networks: - mon prometheus-bot: image: tienbm90/prometheus-bot:0.0.1 volumes: - ./telegrambot/config.yaml:/config.yaml - ./telegrambot/:/etc/telegrambot/ networks: - mon restart: always vmalert: image: victoriametrics/vmalert depends_on: - "vm" - "alertmanager" volumes: - "./vm/noc-prometheus-alerts/:/etc/alerts/" command: - '--datasource.url=http://vm:8428/' - '--remoteRead.url=http://vm:8428/' - '--remoteWrite.url=http://vm:8428/' - '--notifier.url=http://alertmanager:9093/' - '--rule=/etc/alerts/*.rules.yml' networks: - mon restart: always networks: mon: - Create a directory called grafana, and within it, create a directory called data.
mkdir -p /etc/docker-compose/mon/grafana/data/ - Download dashboards and datasources:
git clone https://code.getnoc.com/noc/grafana-selfmon-dashboards.git /etc/docker-compose/mon/grafana/grafana-selfmon-dashboards/ - Create the vm and admdata directory:
mkdir -p /etc/docker-compose/mon/vm/amdata/ chmod 777 /etc/docker-compose/mon/vm/amdata - In the vm directory, create the vmdata directory and a file named vmagent.yml.
mkdir /etc/docker-compose/mon/vm/vmdata/with the following content:touch /etc/docker-compose/mon/vm/vmagent.yml# my global config global: # Alertmanager address alerting: alertmanagers: - static_configs: - targets: - alertmanagers:9093 # Metrics collections scrape_configs: # Prometheus self-monitorog - job_name: 'vmagent' static_configs: - targets: ['vmagent:8429'] labels: env: 'infrastructure' - job_name : 'victoriametrics' static_configs: - targets: ['vm:8428'] # Metrics from noc, discovery, and consul - job_name: 'noc' consul_sd_configs: - server: '<ip address of NOC server>:8500' # i.e. 192.168.1.25:8500 relabel_configs: - source_labels: [__meta_consul_tags] regex: .*,noc,.* action: keep - source_labels: [__meta_consul_service] target_label: job - source_labels: [env] target_label: env replacement: "dev" # NOC installation type # Collect metrics from telegraf - job_name: 'telegraf' consul_sd_configs: - server: '<ip-address of NOC server>:8500' # i.e. 192.168.1.25:8500 relabel_configs: - source_labels: [__meta_consul_tags] regex: .*,telegraf,.* action: keep metric_relabel_configs: - source_labels: [topic] regex: correlator.dispose.(.+) target_label: pool replacement: '$1' # ClickHouse metrics - job_name: 'ch' scrape_interval: 30s static_configs: - targets: - <ip-address of clickhouse>:8001 # You can enable metric export in NOC Tower by configuring the `clickhouse` section. labels: env: 'dev' # NOC installation type - Download alerting rules into the vm directory.
git clone https://code.getnoc.com/noc/noc-prometheus-alerts.git /etc/docker-compose/mon/vm/noc-prometheus-alerts/ - Create a file named alertmanager.yml in the vm directory. with the following content, replacing with your data:
touch /etc/docker-compose/mon/vm/amdata/alertmanager.ymlglobal: resolve_timeout: 5m smtp_from: alertmanager@prometheus.example.com smtp_smarthost: mx1.example.com:25 smtp_require_tls: false route: group_wait: 30s group_interval: 5m repeat_interval: 8h group_by: [env, node] receiver: 'prometheus-bot' routes: - receiver: blackhole continue: false match: alertname: DeadMansSwitch - receiver: 'prometheus-bot' group_interval: 5m receivers: - name: blackhole - name: 'prometheus-bot' webhook_configs: - url: 'http://prometheus-bot:9087/alert/<id of telegram chat>' - name: email email_configs: - send_resolved: false to: XXX@example.com headers: From: alertmanager@prometheus.example.com Subject: '{{ template "email.default.subject" . }}' To: XXXXXXX@example.com inhibit_rules: - source_match: severity: 'critical' target_match: severity: 'warning' equal: ['alertname', 'instance'] - Create a directory called telegrambot, and within it, create two files: config.yaml and template.tmpl, making sure to replace them with your own values.
mkdir /etc/docker-compose/mon/telegrambottouch /etc/docker-compose/mon/telegrambot/config.yamlconfig.yaml:touch /etc/docker-compose/mon/telegrambot/template.tmpltelegram_token: "<token от бота в telegram>" template_path: "/etc/telegrambot/template.tmpl" time_zone: "Europe/Moscow" split_token: "|" time_outdata: "02/01/2006 15:04:05" split_msg_byte: 10000
template.tmpl:
{{ $length := len .GroupLabels -}} {{ if ne $length 0 }}
<b>Grouped for:</b>
{{ range $key,$val := .GroupLabels -}}
    {{$key}} = <code>{{$val}}</code>
{{ end -}}
{{ end -}}

{{if eq .Status "firing"}}
Status: <b>{{.Status | str_UpperCase}} 🔥</b>
{{end -}}

{{if eq .Status "resolved"}}
Status: <b>{{.Status | str_UpperCase}} ✅</b>
{{end }}
<b>Active Alert List:</b>
{{- range $val := .Alerts }}
  Alert: {{ $val.Labels.alertname }}
  {{if HasKey $val.Annotations "message" -}}
  Message:{{ $val.Annotations.message }}
  {{end -}}
  {{if HasKey $val.Annotations "summary" -}}
  Summary:{{ $val.Annotations.summary }}
  {{end -}}
  {{if HasKey $val.Annotations "description" -}}
  Description:{{ $val.Annotations.description }}
  {{end -}}
  {{if HasKey $val.Labels "name" -}}
  Name:{{ $val.Labels.name }}
  {{end -}}
  {{if HasKey $val.Labels "partititon" -}}
  Partition:{{ $val.Labels.partition}}
  {{end -}}
  {{if HasKey $val.Labels "group" -}}
  Group:{{ $val.Labels.group }}
  {{end -}}
  {{if HasKey $val.Labels "instance" -}}
  Instance:{{ $val.Labels.instance }}
  {{end -}}
  {{if HasKey $val.Labels "queue" -}}
  Queue:{{ $val.Labels.queue }}
  {{end -}}
  {{if HasKey $val.Labels "pool" -}}
  Pool:{{ $val.Labels.pool }}
  {{end -}}
  {{if HasKey $val.Annotations "value" -}}
  Value:{{ $val.Annotations.value }}
  {{end -}}
  Active from: {{ $val.StartsAt | str_FormatDate }}
  {{ range $key, $value := $val.Annotations -}}
{{- end -}}
{{- end -}}
Configuring selfmon
- Access the NOC Tower web interface at
:8888. - Select "Environment" and click on "Pull."
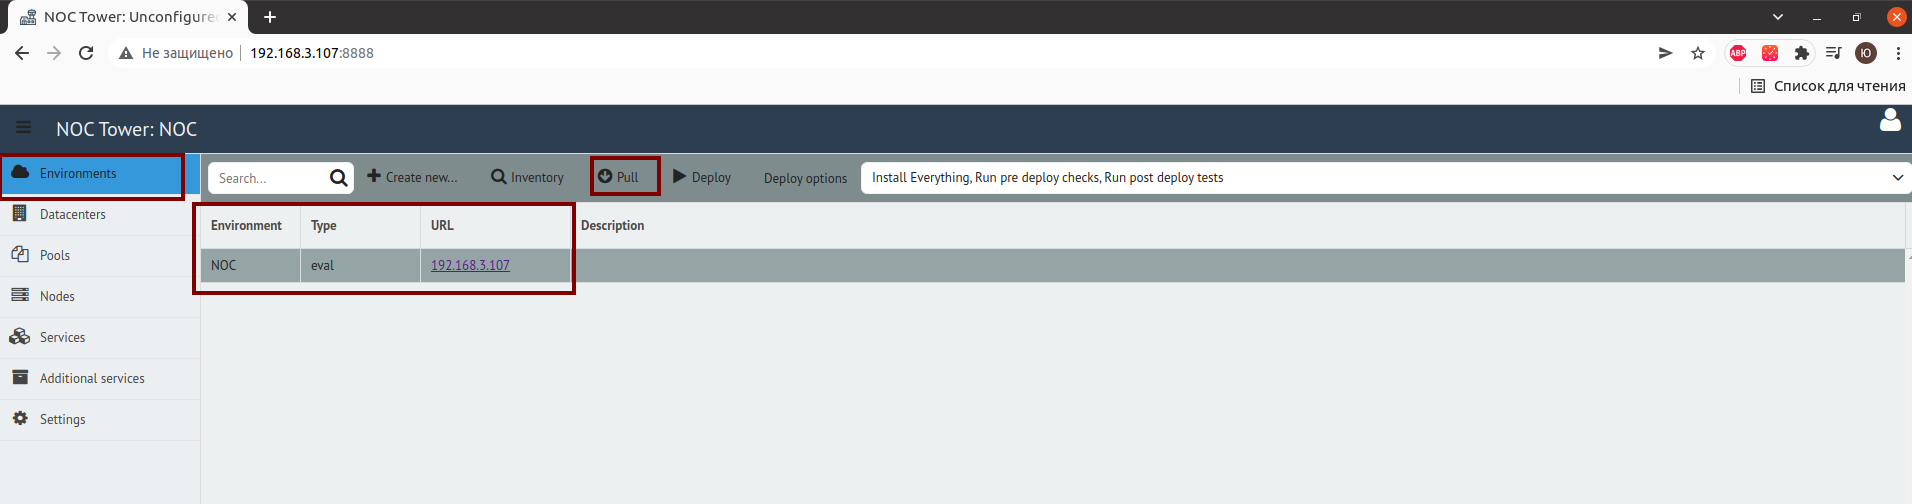
- Next, go to "Services," choose "selfmon," and select the checkboxes for the items you want to monitor.
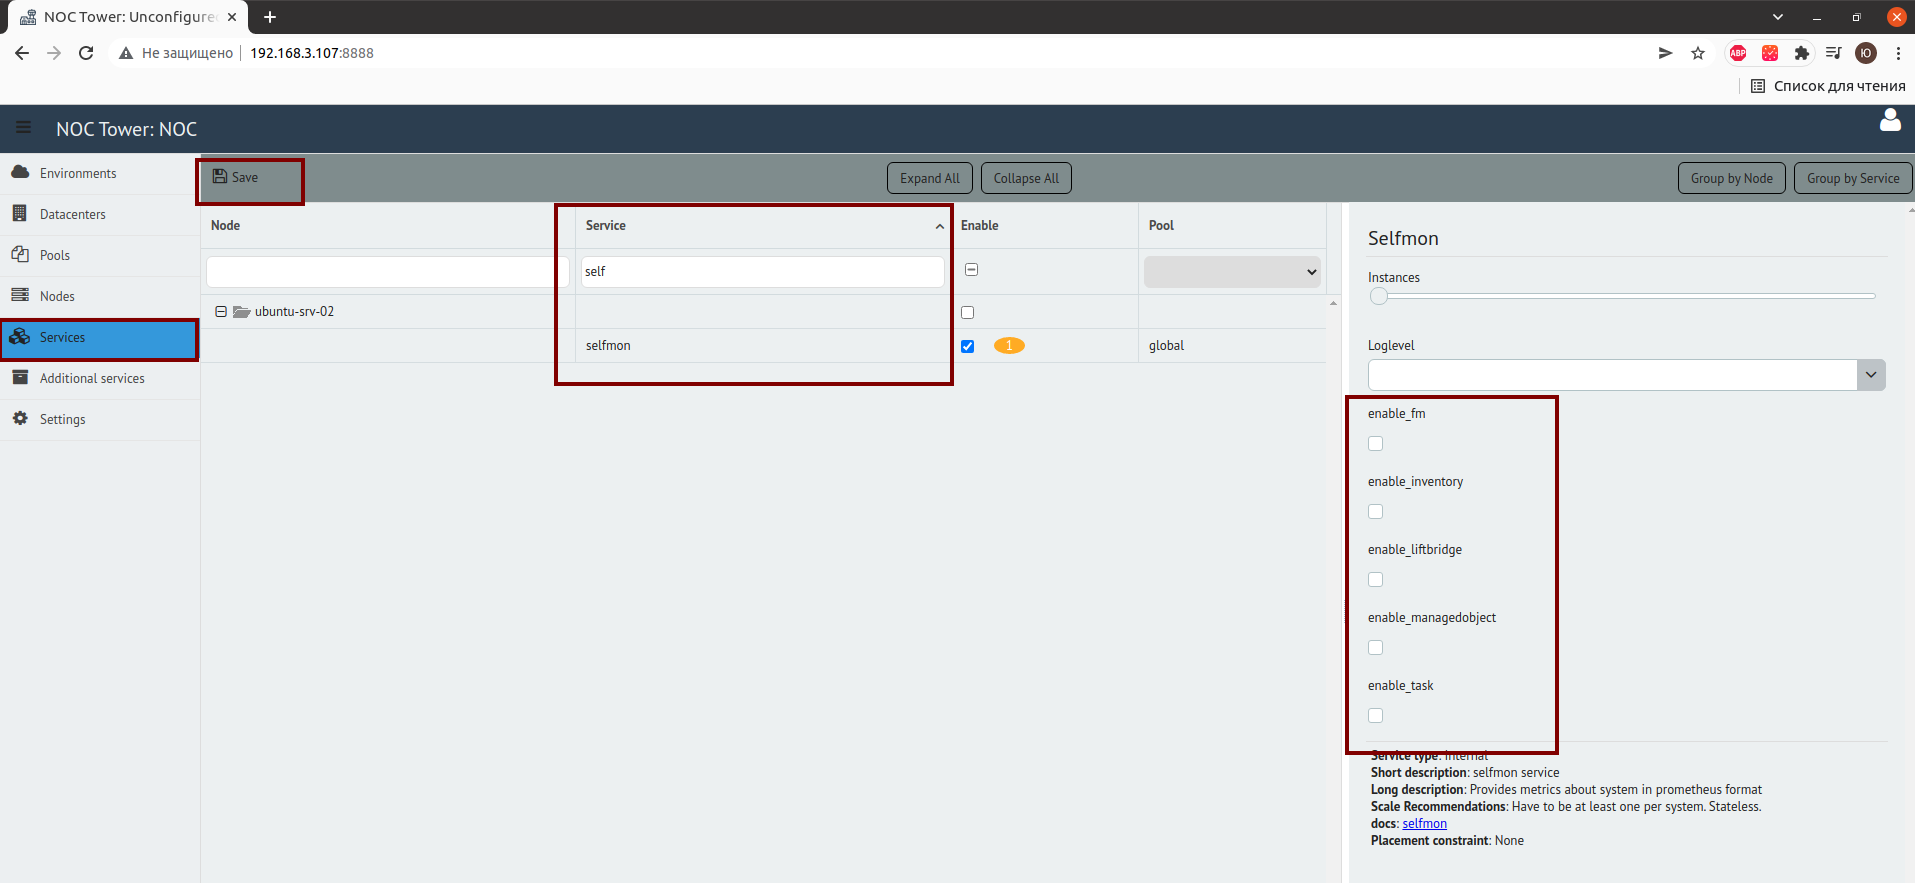
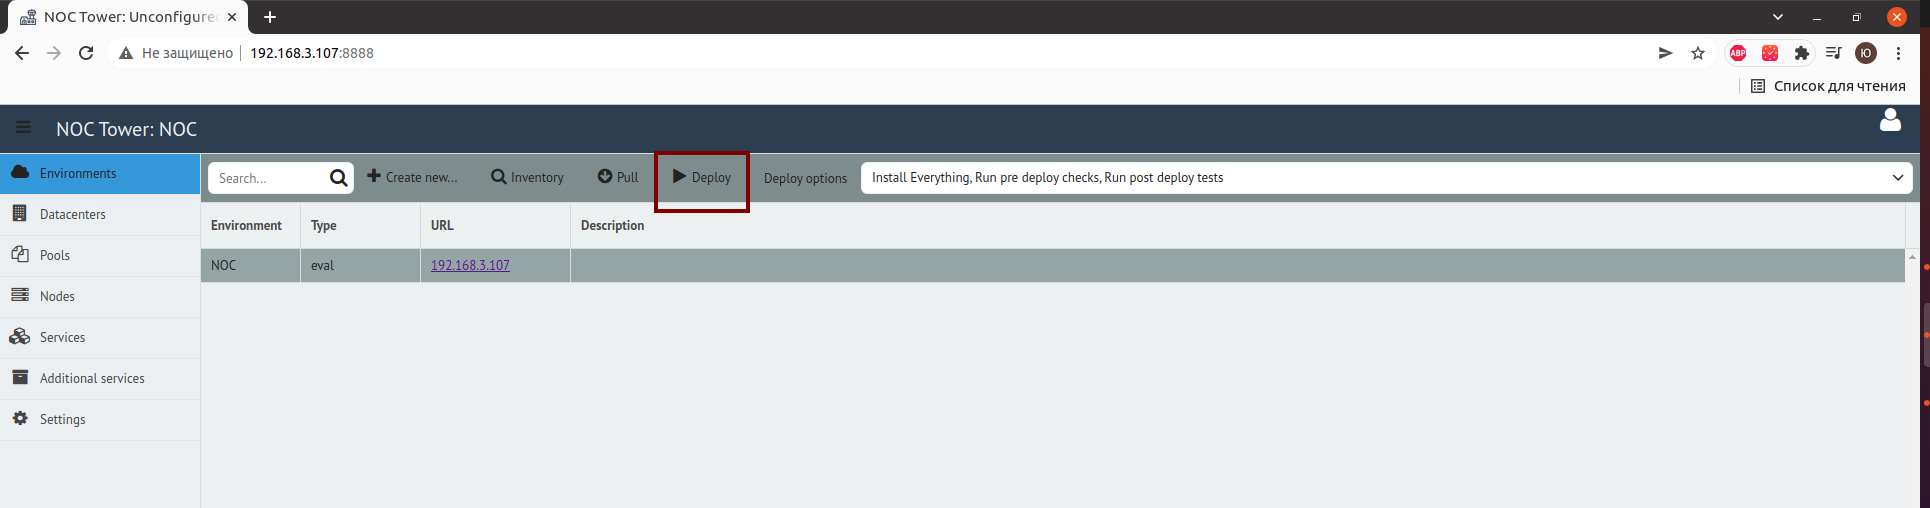
- Deploy the changes.
Restarting NOC Services
- Navigate to the directory where NOC is installed (e.g., /opt/noc).
- Execute the following command:
./noc ctl restart all
Starting Monitoring
- Navigate to the directory where the docker-compose.yml file is located.
cd /etc/docker-compose/mon/ - Start the monitoring.
docker-compose up -d
- Select "Environment" and click on "Pull."