Fault Management
The main task of Fault Management is to receive, process, and respond to events. Events can result from the operation of equipment, user actions, equipment errors, and other sources. A functioning network can generate thousands of events per minute. The FM module allows real-time:
- Receiving event messages from various sources:
- ICMP - device availability checks
- SNMP - receiving SNMP Traps
- Syslog - receiving Syslog from devices
- Metric Thresholds - threshold-based events
- Discovery Results - device discovery results
- Synchronization Messages with devices
- Classifying events based on rules
- Enriching events with data from the system
- Creating alarms based on events
- Correlating alarms and automatically determining the root cause
- Reacting to alarms:
- Sending notifications
- Initiating diagnostics
- Escalation
- Grouping alarms
- Working with alarms in the user interface
- Analyzing alarms based on the BI subsystem
When working with events, the following terms are used:
- Event
- Event Class - the value of an event
- Event Classification - the process of analyzing an event, culminating in assigning a class
- Alarm - an event that requires a response
- Alarm Class - the value of an alarm
- Alarm Correlation - the process of determining the root cause of an alarm
- Root Cause Analysis (RCS) - determining the root cause of an issue
Event Collection
Events enter the system through various means. Sources can be individual services (collectors) as well as internal system events. Let's explore the available event sources:
| Source | Active | Protocol | Event Class | Alarm Class |
|---|---|---|---|---|
| ping | ICMP | - | NOC | Managed Object | Ping Failed | |
| trapcollector | SNMP | By Rule | By Rule | |
| syslogcollector | Syslog | By Rule | By Rule | |
| Metric Threshold | - | Threshold Profile | Threshold Profile | |
| Config Validation | - | Config Validation Rules | ||
| Alarm Discovery | CLI | By Rule | By Rule | |
| Discovery | CLI | - | - |
Event Processing
Further event processing can follow two paths:
- For events from devices, it's Classifier -> Correlator.
- Internal system events are directed straight to the Correlator.
Event Class
To work with an event in the system, it's important to understand its significance. Traditionally, the Event Class is used for this purpose Event Class. Additionally, event-specific settings are associated with the event class, dictating how the event should be handled. The system includes several special classes:
Unknown | Default- The default class for events (theDroprule is set).
Event Classification
The task of the classification stage is to determine which Event Class the incoming event belongs to and act according to the settings specified in it. To determine the event class, a set of classification rules Event Classification Rule is used, located in the Fault Management -> Setup -> Classification Rules menu.
Events are sent to the classifier one by one events and are transmitted in JSON format, with the content of the data field being filled at the source:
source- Event source:syslog- Syslog collectorSNMP Trap- SNMP Trap collectorsystem- Some system services (ping,discovery)other- Unknown source
collector- Pool Pool- Specific data (dependent on the source):
message- Contains the syslog message1.3.6.1.6.3.1.1.4.1.0(snmpTrapOID) - OID- ...
Example of a Syslog event:
{"ts":1637243036,"object":"61088","data":{"source":"syslog","collector":"default","message":"%AAA-I-DISCONNECT: User CLI session for user user1 over telnet , source Y.Y.Y.Y destination X.X.XX.X TERMINATED."}}
Example of SNMP Trap:
{"ts":1637243038,"object":"45324","data":{"source":"SNMP Trap","collector":"default","1.3.6.1.2.1.1.3.0":"973858","1.3.6.1.6.3.1.1.4.1.0":"1.0.8802.1.1.2.0.0.1","1.0.8802.1.1.2.1.2.2":"3","1.0.8802.1.1.2.1.2.3":"1","1.0.8802.1.1.2.1.2.4":"0","1.0.8802.1.1.2.1.2.5":"1"}}
For the incoming event, a suitable rule is found by comparing data with the template. Rules are traversed in ascending order of priority. It is important to note that in the absence of corresponding MIBs in the rules, numerical representations of OIDs should be used.
Info
In the absence of MIBs in the rules, numerical representations of OIDs should be used.
Classification Rule Structure
The primary working component of a classification rule Classification Rule is a set of templates used for comparing messages. These templates consist of a collection of regular expressions applied to the field name and its value in the message's data field. The rule is considered a match if all the regular expressions match. Named groups become event variables.
For example, let's take a look at a classification rule for an SNMP Trap of the Link Down class.
The event looks like this:
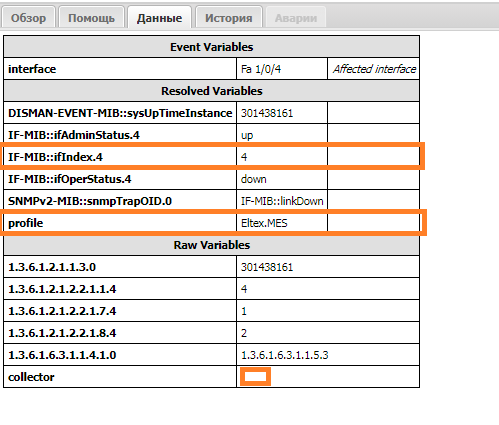
Raw Variables- variables received from the collector in thedatafield.Resolved Variables- variables for which a corresponding MIB has been found and added by the classifier. For instance, the variableprofilewas added by the classifier from the device's data (ManagedObject).Event Variables- variables included in the event (configured in the class).
Let's examine the rule under which this event falls (you can find it on the History tab):
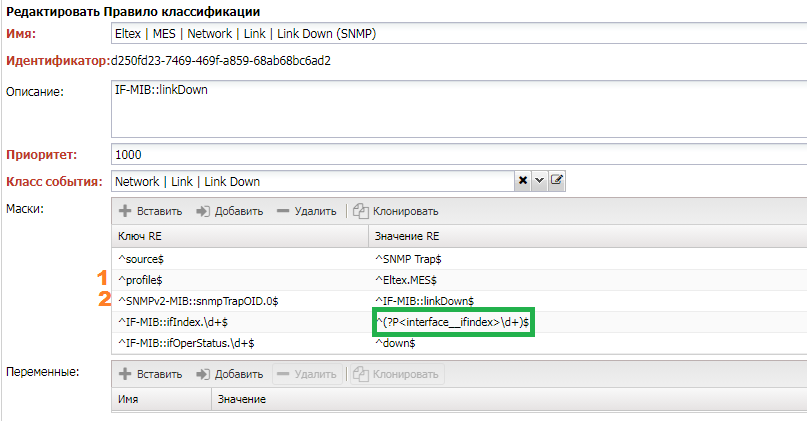
- The
sourcematchesSNMP Trap, indicating that the rule is intended only for events received viaSNMP. profilespecifies that the rule is only for devices with theEltex.MESadapter.- The rule for a specific
Trapis identified through theTrap OID. - Next are fields specific to the particular
Trap, whereIF-MIB::ifIndex.\d+extracts the interface index. - The use of the
interface__ifindexconstruct tells the system to find theinterfacevariable based on theifindexof the interface. - Through
IF-MIB::ifOperStatus, it is noted that we are interested in the interface goingdown.
In the case of Syslog, the main variable is message, which contains the message text.
Event Filtering
To protect the system from overly verbose devices, you can configure event filtering rules. There are two types of event filtering:
- Ignored Patterns.
Fault Management -> Setup -> Ignored Patterns - Ignored Rules.
Fault Management -> Setup -> Ignored Rules
Currently, Ignored Rules are not in use and do not function.
Patterns only work with Syslog and SNMP Trap events. Right after receiving a message, the values of the message or 1.3.6.1.6.3.1.1.4.1.0 fields are checked against the regular expression specified in the pattern. If there is a match, the event is discarded.
Event Deduplication
This mechanism allows you to exclude duplicate events within a specified time interval. The interval itself is configured in the Event Class Event Class and operates as follows:
- If the
Deduplication Windowsetting is greater than 0. - For each incoming event, a fingerprint is calculated, which includes the device, event class, and variables.
- If there is a registered fingerprint within the
Deduplication Windowinterval from the time of the current event, event processing is stopped.
? allowed_time_drift
Event Duplicates
This mechanism allows you to track event duplicates from equipment. When a duplicate is detected, instead of creating a new event, the duplicate counter (repeats) in the event is incremented. To make this work, you need to mark variables based on which duplicates will be counted:
- If the
Suppression Windowsetting is greater than 0. - For each incoming event, a fingerprint is calculated, which includes the device, event class, and variables marked as
Match Suppress. - If there is a registered fingerprint within the
Deduplication Windowinterval from the time of the current event, therepeatscounter is increased for the event.
Event Time-to-Live (TTL)
This mechanism involves removing events after a specified time. After the time specified in the TTL setting of the Event Class Event Class elapses, the event will be removed from the system. If the event has been passed to the correlator, expiration is canceled.
Disposition Rules
The further fate of an event is determined in the settings of the Disposition Rule for the Event Class Event Class. It acts as a routing table. After matching an event with the class, a sequential check of disposition rules begins. When a condition (condition) matches, the specified action is executed.
Alarm Classes
Events that require a response are called alarms. For alarms, there are separate Alarm Classes (Alarm Class) that describe their significance for the system with a distinct set of settings. Alarms support escalation to external trouble ticket systems, analytics, and notifications.
Alarm Correlation
The primary task of the correlator is to reduce the number of events by establishing the root cause (correlation) and grouping them. This allows signaling to the operator only what is worth paying attention to, filtering out less important events by assigning severity levels (severity).
Events are sent to the correlator correlator sequentially through the dispose.
The correlator identifies relationships between events from different sources, correlates them, and groups them, resulting in alarm events - Alarms.
Correlation by Rules
The table with correlation rules is placed in the Alarm Class Alarm Class in the "Root Cause" section:
- Name - the name of the rule.
- Root Cause - a reference to the root cause alarm class.
- Window - the interval within which the search for the root cause is performed.
- Condition - conditions for checking the applicability of the rule. It's expressed in Python with access to the alarm through the 'alarm' variable. For example, 'alarm.vars.get('link') is not None'.
- Match Condition - additional criteria for matching the root cause ('Root'). The expression for querying the current alarm is available through the 'alarm' variable. For example, searching for alarms on the same device - '{"managed_object":"alarm.managed_object.id"}'.
After creating the alarm, the correlator sequentially goes through the records in the table. If the condition ('Condition') is successfully checked, a search is performed for an active alarm within the window ('Window') using the alarm class specified in the root cause ('Root') and the matching criteria ('Match Condition'). The found alarm is indicated as the root cause, and the search is then terminated.
As an example, let's consider possible root causes of equipment unavailability ('NOC | Managed Object | Ping Failed').
Three possible variants are indicated - 'Power Failed,' 'Total Power Loss,' and 'System Reboot.' The condition is expressed as a Python expression - always returning true. The matching criteria restrict the search for alarms on the same device ('managed_object').
Correlation by Topology
Correlation by topology uses the collected network topology Topology to determine the root cause of an alarm. It is performed within the scope of a single alarm class and only based on device topology (ManagedObject). It is enabled by the 'Topology RCA' setting in the alarm class. Currently, it is only activated for the 'NOC | Managed Object | Ping Failed' class, which describes device unavailability via 'ICMP' from the system.
The algorithm is quite simple. When building the device topology, the upstream direction Uplink is calculated for them. A search is then made for the 'NOC | Managed Object | Ping Failed' alarm on the upstream device. If it is found, it is considered the root cause for the current alarm.
Todo
Clarify whether correlation by topology or rules is performed first.
Severity and Weight
After detecting an alarm on specific equipment, the system calculates the weight Weight of the alarm and determines in which severity interval of the base importance values Severity the alarm falls. The weight is calculated using a formula that takes into account the impact on associated components through weight coefficients:
- Device ManagedObject. The weight coefficient is set in the object profile Managed Object Profile.
- Interfaces of the device Interface. The weight coefficient is set in the interface profile Interface Profile.
- Services associated with the device Service. The weight coefficient is set in the service profile Service Profile.
- Subscribers associated with the device Subscribers. The weight coefficient is set in the subscriber profile Subscriber Profile.
Info
The weight of subordinates is added to the weight of the root cause in addition to its own weight.
Severity levels Severity of alarms are configured in the menu Fault Management -> Setup -> Alarm Severities. It specifies the minimum weight required to set the corresponding severity. The following default levels are provided:
CRITICAL- The highest severity level of the alarm.MAJOR- Major alarm.MINOR- Minor alarm.WARNING- An event requiring operator attention.INFO- Informational.IGNORE- A normal event that does not affect the network's status.