Custom Static Dashbord with Device Charts
NOC uses Grafana to display device dashboards. All built-in dashboards are generated dynamically basing on the inventory data. The only supported way to modify them is to write a Python code. But NOC also exposes raw data via Grafana Datasources, which can be used to create own dashboard.
Thesises
- Grafana provides functionality to create dashboards.
- NOC offers two datasource types:
Clickhouse: Allows to build direct queries to the Clickhouse metric databaseJSON: NOC's special API to access data- The NOC's users are exposed to Grafana, allowing to set up permissions.
- External Grafana can be used to access NOC's data
Creating Dashboards
There are two ways to access Grafana:
- Via
Graphbutton in Managed Object's form. - Via direct link:
https://<noc host>/ui/grafana
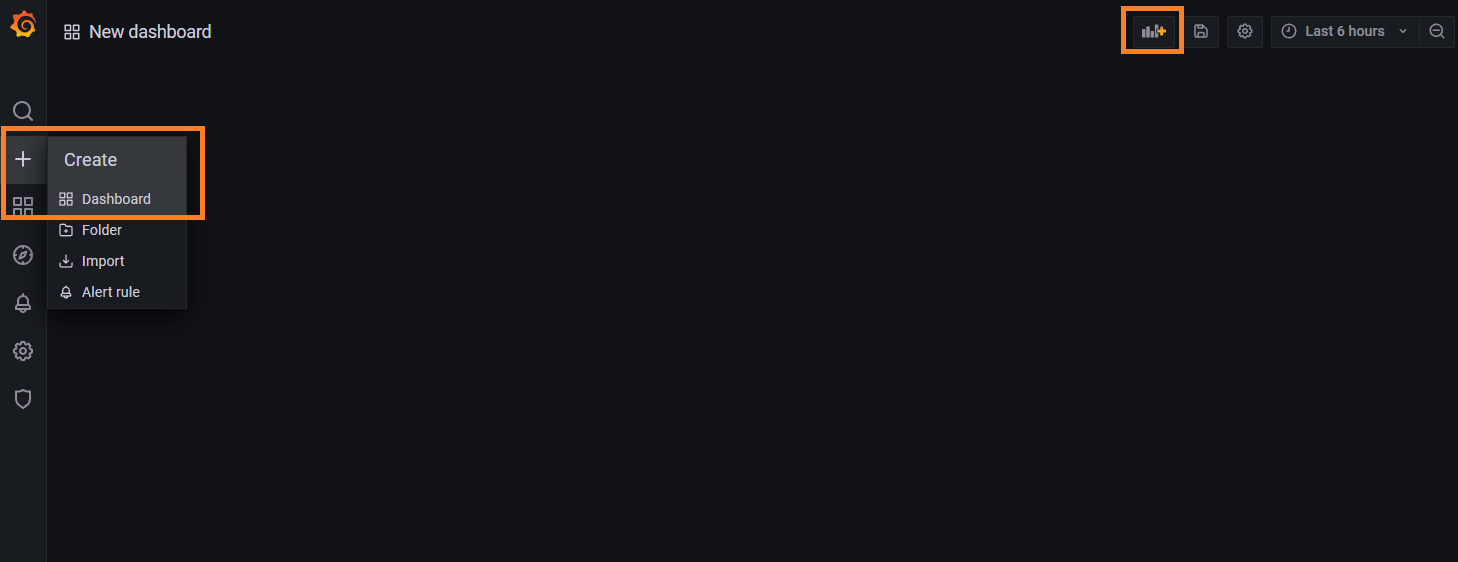
Press plus sign on a left panel. By default, this action is available to all users. The empty dashboard will be open. Then add all necessary charts, variables, and strings.
When adding panel you must select proper datasource.
Clickhouse Datasource
Performs direct queries into Clickhouse and allows to build graphs. Internally uses Vertamedia Clickhouse Datasource plugin.
Note
It is mandatory to keep in mind ClickHouse table structures. Refer to the Metric Types Reference and Metric Scopes Reference for details.
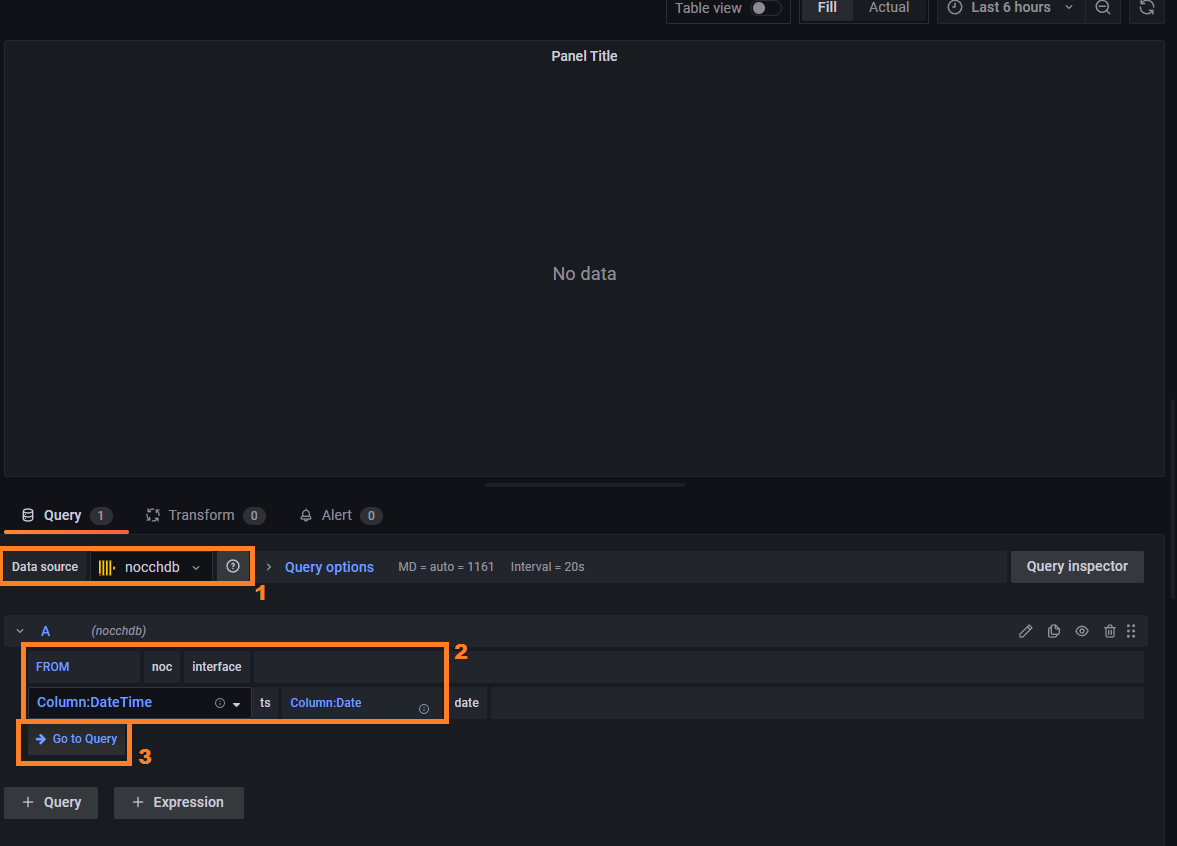
When adding the panel:
- Select datasource
nocchdb Fill
FROMparameters:Database:
noc- Table: Select Metric Scope
Timestamp Column:
tsPress
Go to Querybutton.
The simplest way to build a query is to copy it from existing dashboard. The Managed Object is referred via bi_id identifier, which is seen in the Managed Object's form. It must be placed in query as
managed_object = <bi id>
The query may also contain plugin variables.
$timeSeries- passes time in the proper format.$timeFilter- time range condition according graph interval.$table- table name from the panel's settings.
For example, query by interface may look as:
SELECT $timeSeries as t, argMax(load_in, t) as Input, argMax(load_out, t) as Output
FROM $table
WHERE managed_object = $bi_id and interface='Eth 1/0/1' and subinterface == '' and queue = '' and traffic_class = '' and $timeFilter
GROUP BY t ORDER BY t
Uptime data query:
SELECT $timeSeries as t, avg(sys_uptime) as `Uptime`
FROM $table
WHERE managed_object=$bi_id and $timeFilter
GROUP BY t ORDER BY t
Note
Refer to the Metric Types Reference and Metric Scopes Reference for the available tables and their structure.
JSON Datasource
Uses simpod-json plugin. Data set is restricted by GrafanaDS service, but can be extended via custom targets.
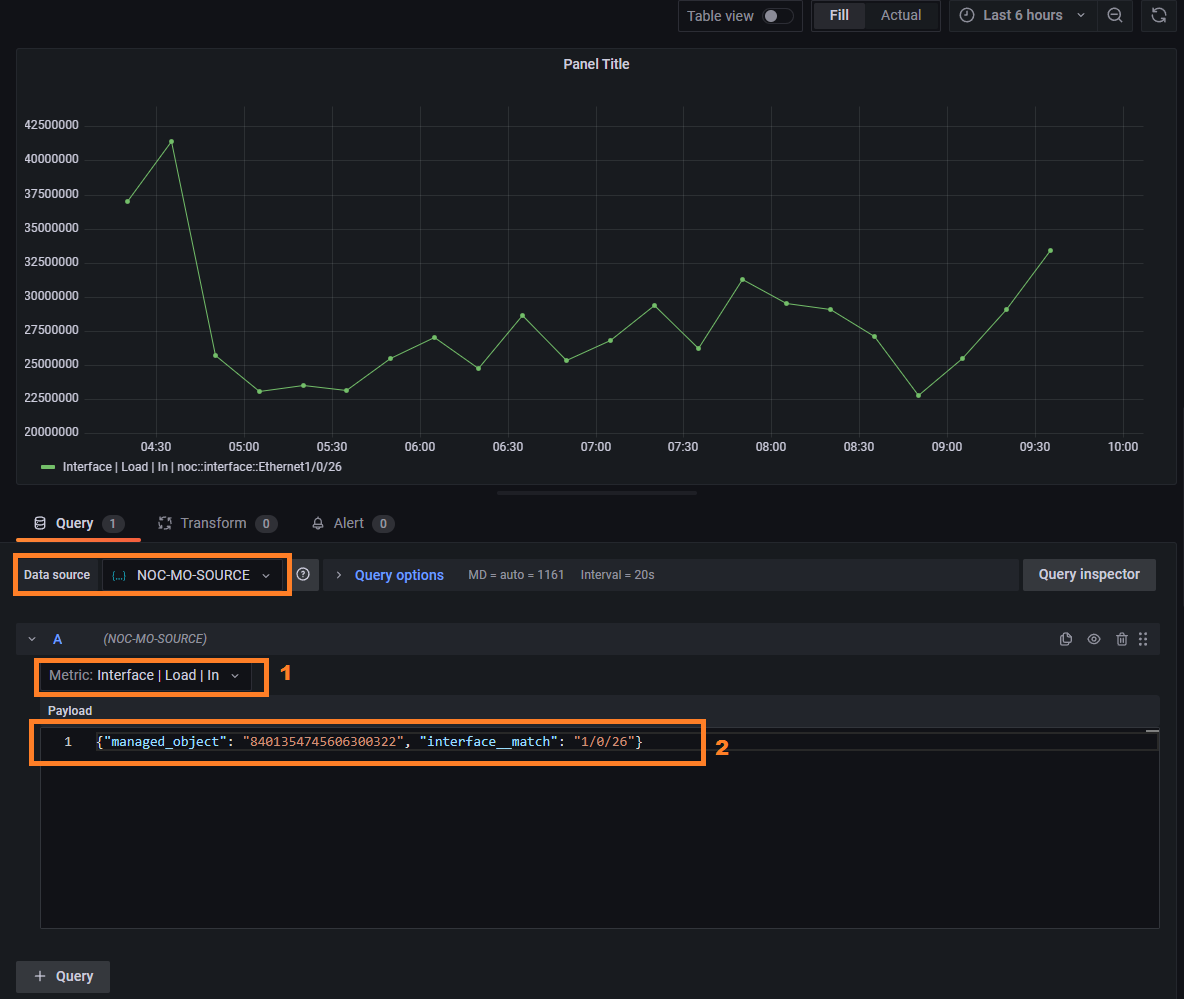
When adding the panel:
- Select datasource:
NOC-MO-SOURCE - Select metric from drop-down list. Only one metric per query may be selected.
Fill query coditions, which will be passed to
WHEREclause.Warning
All values always must be enclosed in quotes
Warning
JSON format strips values over 32-bits
Fill
targetfield which defines available conditions. Following targets are available:
| Target | Query | Variables | Description | Conditions |
|---|---|---|---|---|
labels | Available Labels | - | ||
managed_object | Queery by ManagedObject | labels administrative_domain | ||
interface_profile | Query by Interface Profile | managed_object - Managed Object's Id | ||
interface | Query interface names | managed_object - Managed Object's Idname - interface name (regular expression)interface_profile - interface profile identifier |
Interface load query:
{"managed_object": "8401354745606300322", "interface__match": "1/0/26"}
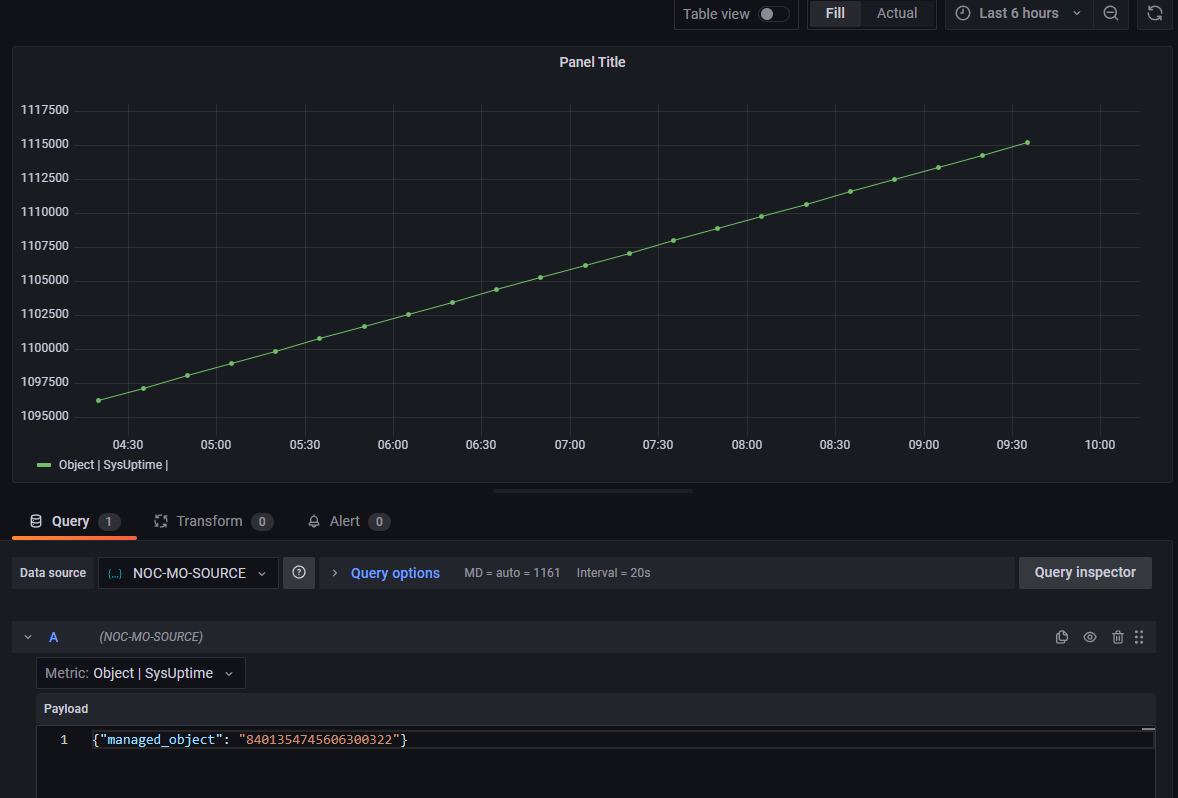
Uptime query:
{"managed_object": "8401354745606300322"}
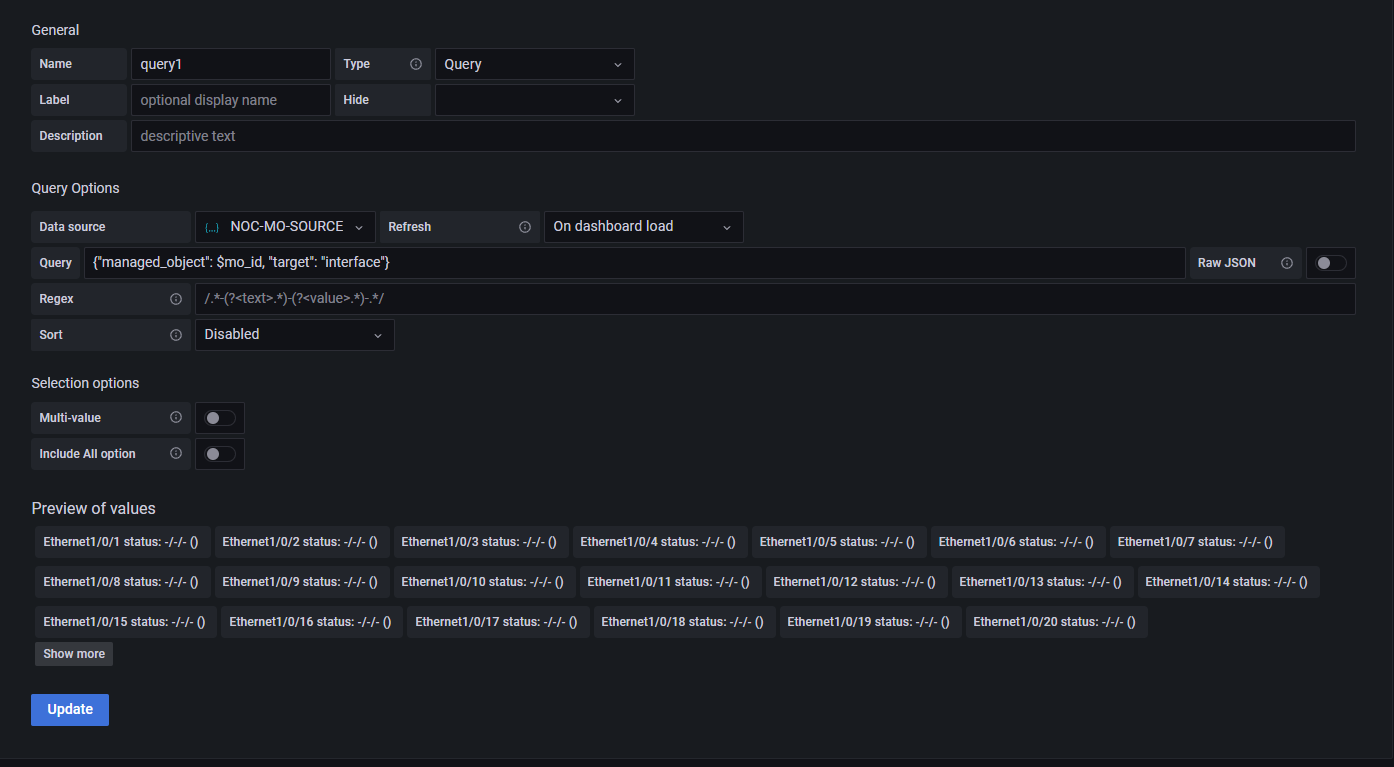
Variables
The variables can be used to parametrise a dashboard. They can be added via Variables menu and are available via dashboard settings (the cog icon to the right of the plus button)
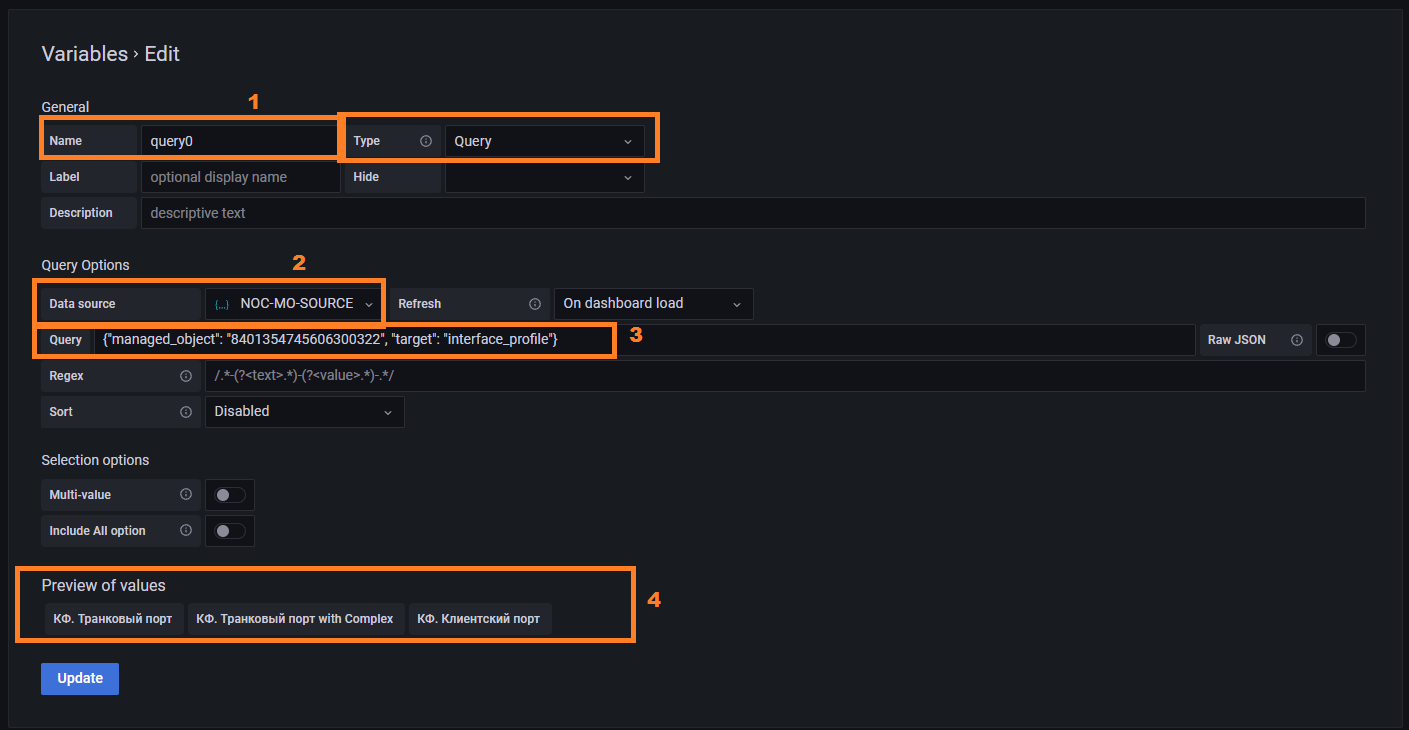
- Fill name field to define the variable name.
Querytype allows to query datasources. - Choosee
NOC-MO-SOURCE - Add query. I.e. to add interface profiles:
{"managed_object": "8401354745606300322", "target": "interface_profile"} - Look for result. In case of error the result will be empty.
Other variable names may be used in query. For example, lets add mo_id variable:
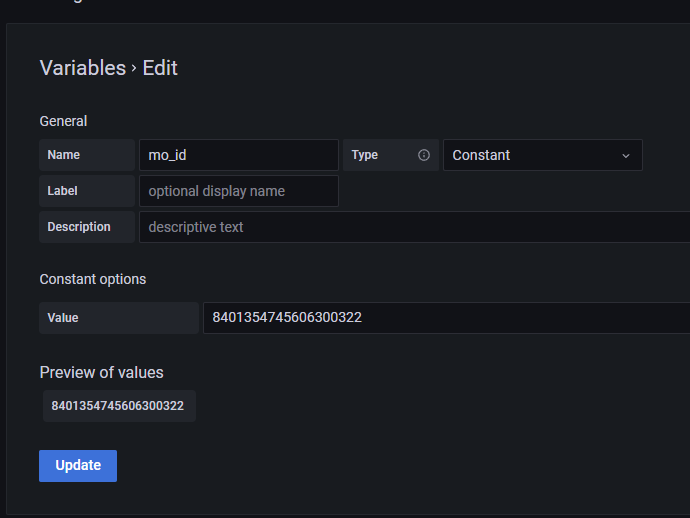
And then refer to in from other variable to query interfaces. Reference are passed via dollar sign before the name: